Every result, from the tester.
Straight from the MetaTrader 5 Strategy Tester, untouched. $10,000 account, 2020 to September 2026. The Portfolio is the product; the Titan tab shows that one strategy on its own, so you can see why the three are sold together.
Titan · XAUUSD M15 · Darwinex real ticks2020 to 2026
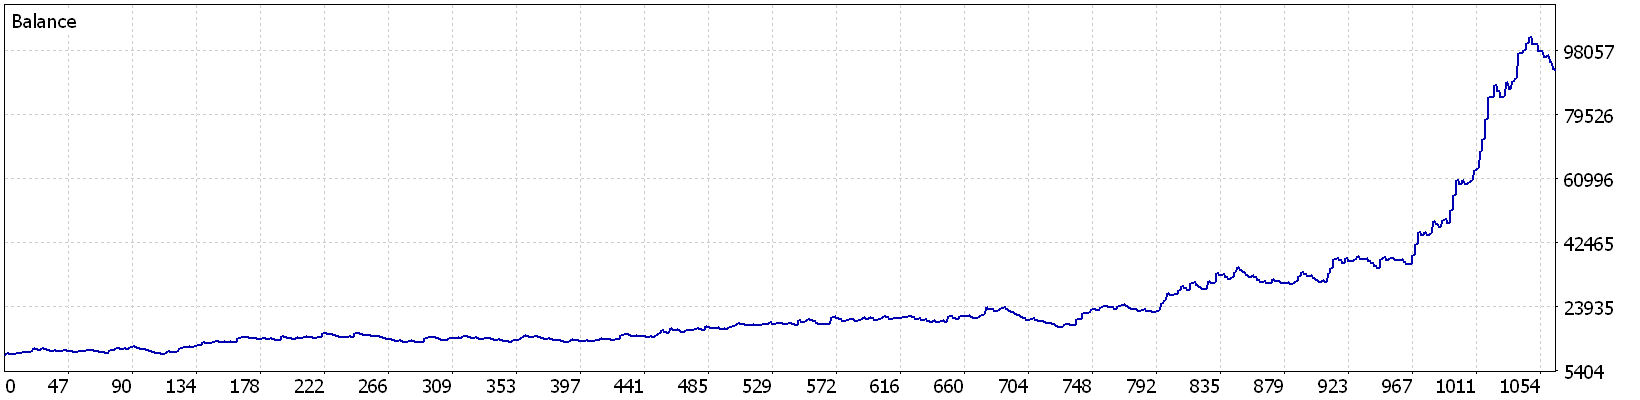
+823%Net return
1.78Profit factor
531Trades
26.52%Worst drop
Titan · XAUUSD M15 · IC Markets generated2020 to 2026
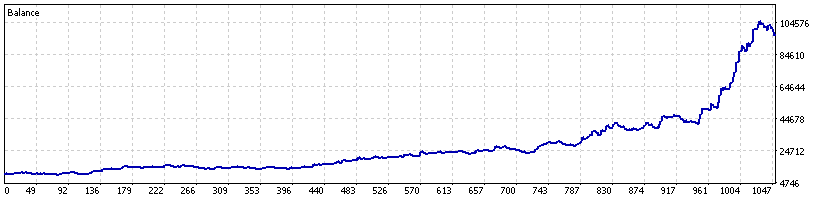
+866%Net return
1.77Profit factor
523Trades
18.97%Max drawdown
Titan · XAUUSD M15 · IC Markets real ticksJan 2025 to 2026
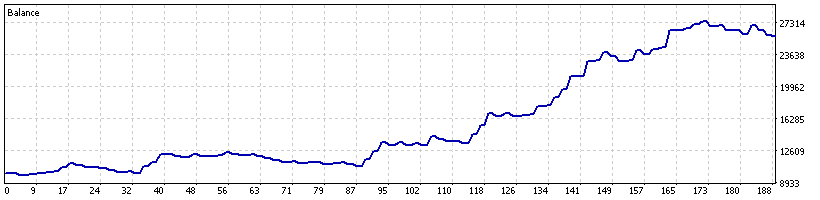
+158%Net return
2.41Profit factor
94Trades
16.01%Max drawdown
IC Markets only holds real ticks from 2025, so the six year IC run uses generated ticks. Both feeds land at a profit factor of 1.77 and 1.78. Titan trades about 80 times a year with wide stops, so spread barely touches it; its largest cost is overnight swap, so check a broker's gold swap rates.
Titan waits for its setup and can go a long time without trading. Over the six and a half years its longest silent stretches were 55, 50 and 49 days. That is the system working, not a fault. The Portfolio covers those gaps because its strategies go quiet at different times.
Portfolio · gold · Darwinex real ticks2020 to Sept 2026
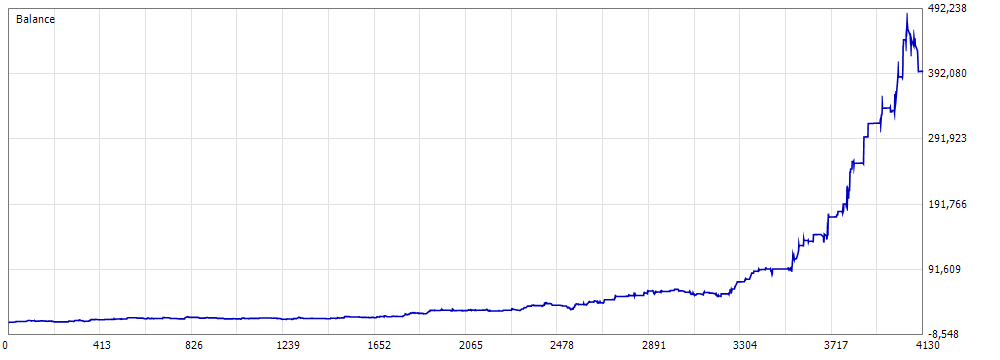
+3,874%Net return
1.87Profit factor
4,129Trades
29.3%Max drawdown
Portfolio · gold · IC Markets generated2020 to Sept 2026
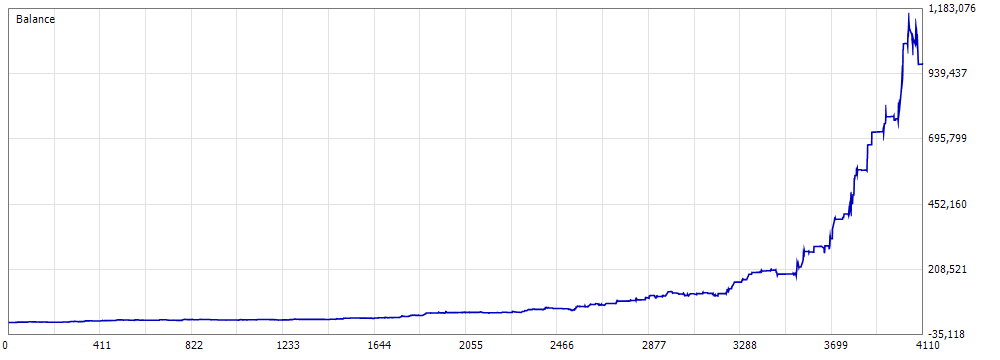
+9,694%Net return
2.09Profit factor
4,109Trades
20.8%Max drawdown
Portfolio · gold · IC Markets real ticksJan 2025 to 2026
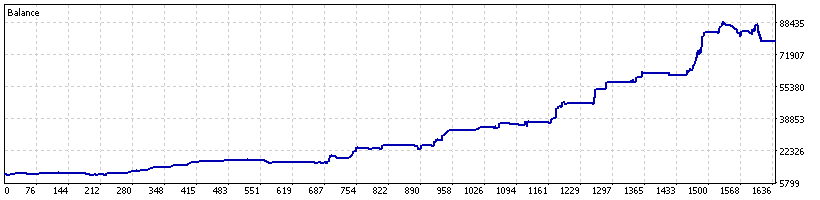
+691%Net return
2.29Profit factor
898Trades
16.01%Max drawdown
Portfolio · gold · Growth preset, Darwinex real ticks2020 to Sept 2026
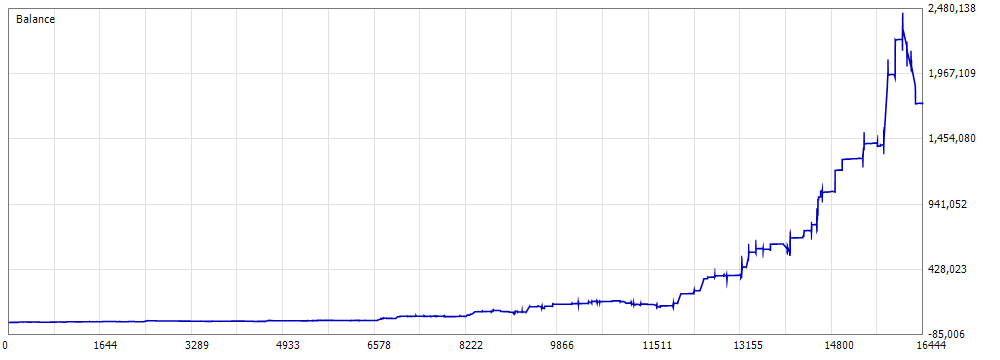
+17,317%Net return
1.84Profit factor
16,443Trades
29.5%Closed drawdown
Run at $10,000 on the settings the product ships with, 2020 to the latest data (5 September 2026). Profit factor is 1.87 on real ticks, 2.09 on generated; plan around 1.87. These are version 2.1.2 runs with the 30-minute pre-news entry skip and the Strike year-end pause on, which is how the product ships. Every year from 2020 to 2026 is profitable on both feeds. Minimum account is $3,000, measured.
The three strategies go quiet at different times, and that is the reason to own the Portfolio rather than one EA. Alone, Titan's longest stretch with no trade is 55 days and the second strategy's is 88. Together the longest is 21 days on Darwinex and 24 on IC Markets, and there is not one gap of a month in six and a half years.
About the Growth tab. Growth is a risk preset the software ships with, not a different strategy. It compounds on the current balance rather than sizing off the starting one, so as the account grows the positions grow with it. On the same feed and the same window it returns 17,317% against the default 3,874%, and takes 16,443 trades against 4,129. It also has a lower profit factor, 1.84 against 1.87, and its worst floating drawdown is 40.7% against 29.3%. It is shown because it is a setting you can turn on and you should be able to see what it does, not because we recommend it. The default is the default for a reason. Two things to understand before choosing it: the account was still 27.0% below its high when the data ended, and the dollar figure at the far right of that curve is not achievable in practice, because at those balances the system is trying to put dozens of lots into the market at once and every fill in a backtest is assumed to happen at the quoted price.
Read the drawdown figures as a floor, not a forecast. Reshuffling the same 2020 to 2026 trades 5,000 times in blocks puts the median worst drawdown at 21 to 25%, the 95th percentile at 31 to 38% and the 99th at 36 to 44% depending on the feed; the actual path reaches 29.3% on real ticks. The longest stretch below a previous high runs a median of 7 to 10 months. Plan for the 95th percentile, not the backtest. These are backtests on gold, not a live money record. Past performance does not guarantee future results.